
Effects of game difficulty
For a casual mobile game difficulty is one of the most important concepts of the gaming experience. Different skills cause different sense of difficulty. Very skilled players pass the level in their first try while newbies try dozens of times the same level to pass.


Did you play Serious Sam before? I find that game pretty fun; you mindlessly shoot as many enemies as you can, destroy thousands of orc-like creatures that running towards you. Yet one of the most important thing in Serious Sam is the difficulty. If you make that game too hard mindlessly shooting wouldn't be possible for you, but on the other hand, if you make it too easy that can halt a very boring experience. This is the reason Serious Sam asking you a very important question about your preferences with a lot of options.
Generally, developers might not prefer asking too many questions to their players. A good chef must know what their visitors enjoy best without asking them. You consume the game as it is perfected for a general audience. But this yields a very important dilemma as people's desires and skills are not equal.
In this blog, I will share what we did in GoodJob to asses this problem.
Table of Contents
- Introduction
- Effect of difficulty on overall population
- Effect of difficulty on segmented groups
- Conclusion
Introduction
Difficulty is one of the most important concepts of the gaming experience. For a casual mobile game, players usually learn the mechanics and pass the first few levels without much difficulty. These levels are intentionally designed easy and instructive. In these levels, churn is not much controllable, it is all up to the player's desire and game mechanics.
As the player progresses and levels are passed, the game gets more difficult. If difficulty reaches a high levels users might feel frustration, on the other hand if the game feels too simple that might cause boredom.
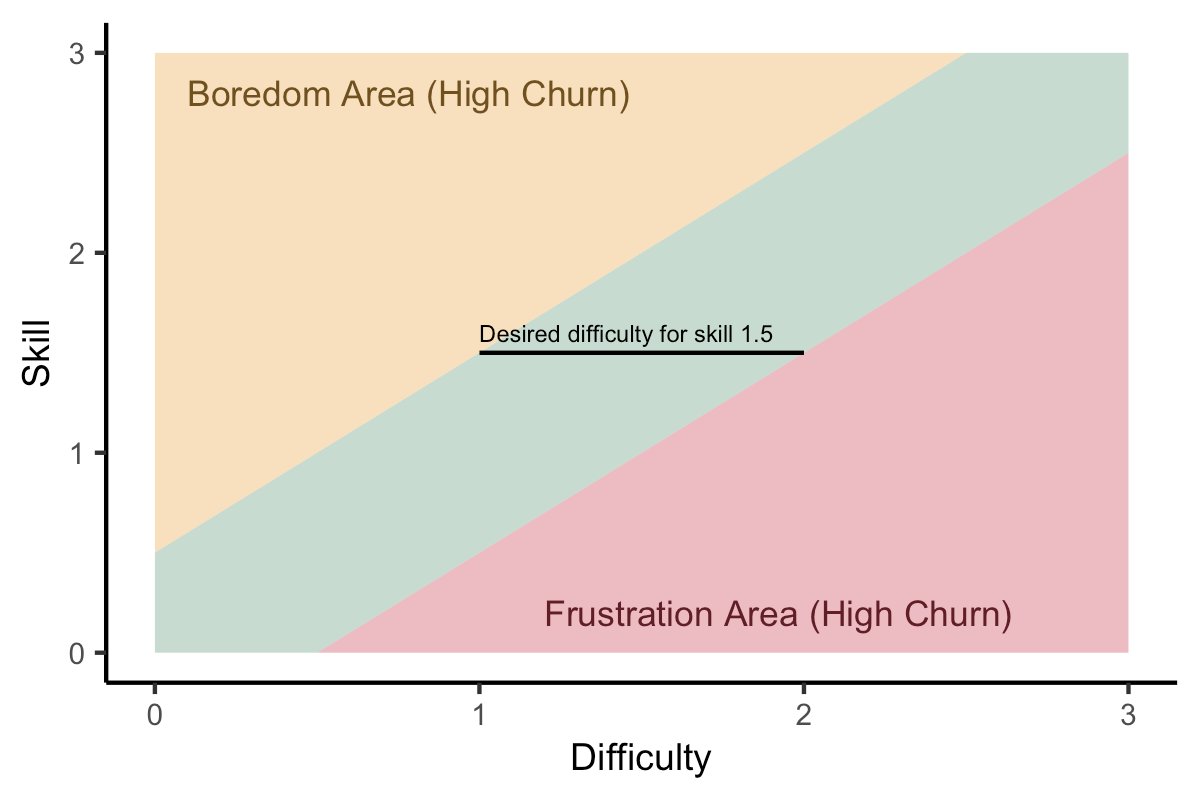
In fact there is no perfect solution for everyone. That is when understanding the player and the perceived difficulty comes in handy. Each player has a distinct skill set, and if they feel that they will be incapable of passing a certain level, they tend to churn. If the level difficulties are properly arranged for the player, the game experience can greatly be improved for everyone. For example, check the Figure 2, skills of each player and difficulty of the levels scaled between 0 to 3. For a player with skill 1.5 difficulty of 2 to 3 might be perfect whereas it will be very easy for the player with skill 3.
Assessing difficulty and skill with a number might very hard to image first but it has a lot of benefits while analyzing the situation. The game has lots of levels and each one has a different difficulty. For our task, we numerified the difficulties of each level.
In this project, we first understand the difficulties of the levels in a numeric way, using various anonymous player data. Then we investigate the relationship between difficulty, player skills and churns. After doing a comprehensive analysis, we decide on when and how to adjust level difficulties according to player skills to maximize player experience.
During the blog we will share our simulated data generated from our real project models to make it more easy to follow and more explainable.
Effect of difficulty on overall population
Game designers can use different difficulty curves in their games but let's assume they increase the difficulty with the levels with fixed wave. You can read more on this subject here.
In the tutorials and the first a few levels players might find the game too easy. In fact they might churn from the game because they can experience the boredom. In other words their skills might be much higher than the game difficulty.
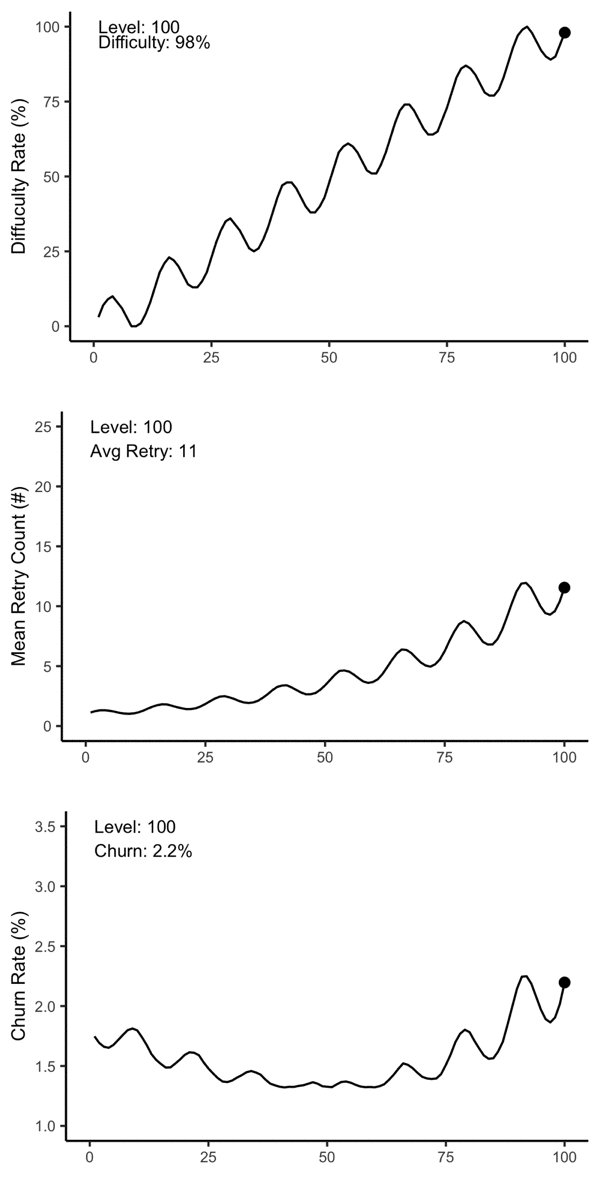
When levels are passed and the game gets more difficult players starts to retry the levels. That shows that players starts to find the levels hard. If retry count increases too much we see an increase on the churn.
When we investigate the Figure 3, we might conclude that there is a perfect difficulty for everyone. The churn is like a convex curve and there is a minimum at certain point. However there is a better solution.
Effect of difficulty on segmented groups
As populations contains different individuals, our players have also a significant variance on their skills. Using a single difficulty level for everyone might be the suboptimal solution. This might yield high churn rates in high skilled players because of the boredom, and high churn rates in newbies (low skilled players) because of frustration.
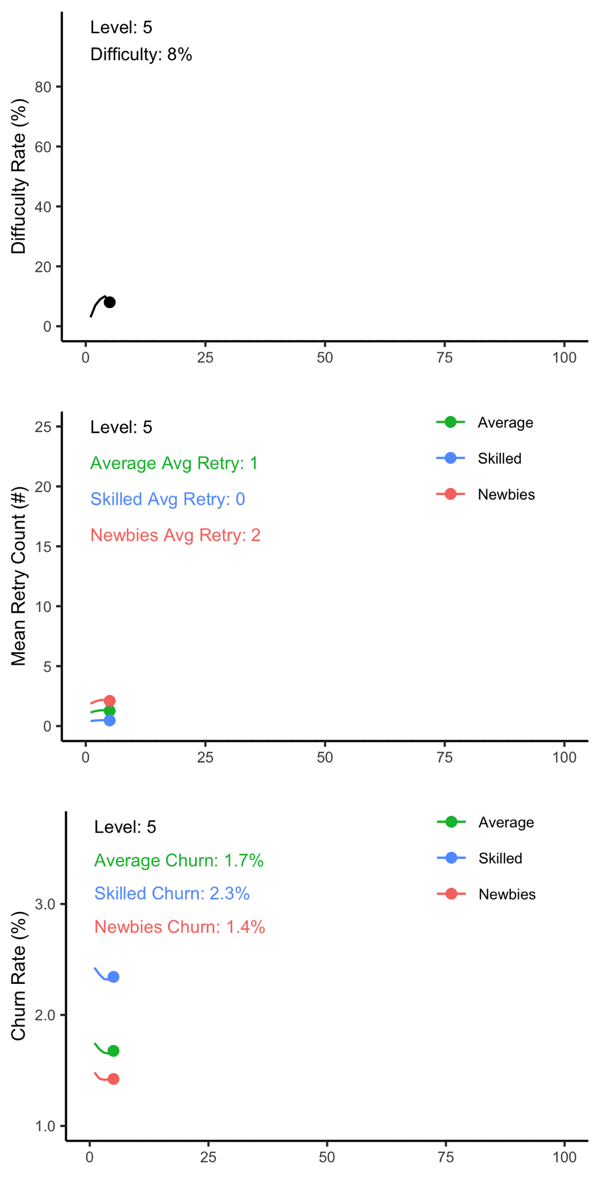
Check Figure 3 and Figure 4, what a difference! Actually there is a group which prefers our game harder. Yet it might not possible to spot them in the Figure 3. This is a perfect example of Simpson's paradox. When the data aggregated the trend might disappear, or worse, reversed as this example.
What happens in the background
Each player might churn because of high number retry or very easy level. Different skills cause different number retry, and different sense of difficulty. Very skilled players pass the level in their first try while newbies try dozens of times the same level to pass.
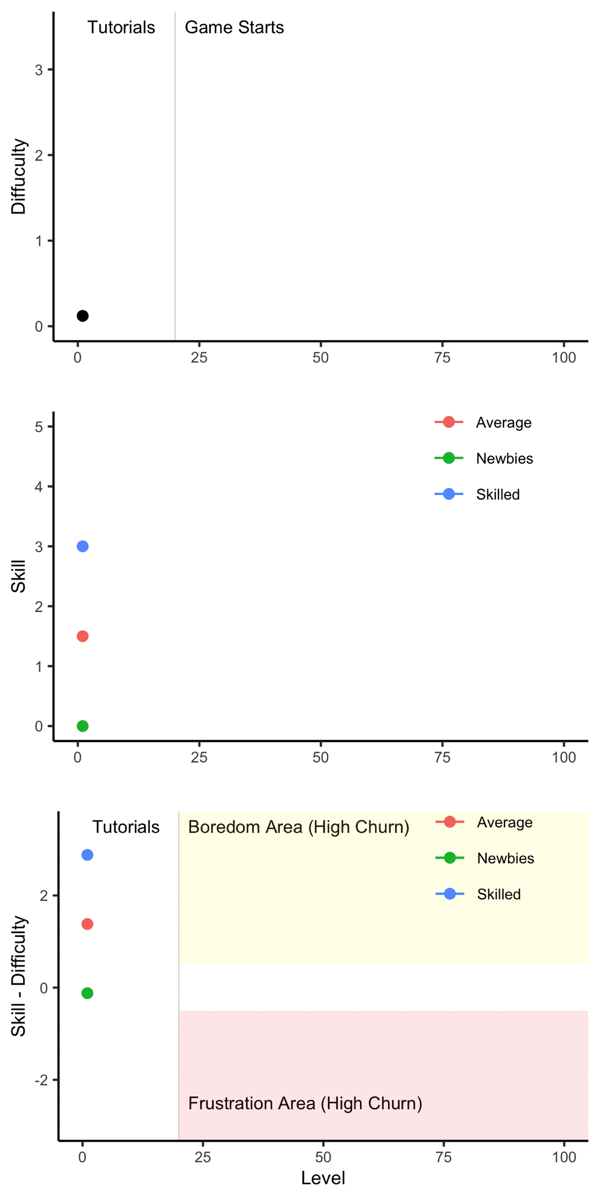
This cause different trends in their churn rates. Now it is very clear that game should be easier for newbies while skilled players might prefer even more hard ones. There is no single perfect solution for everyone, and personalization should be the heart at any product that will be used by different individuals.
Conclusion
Simulation we used in this blog lack of a very important propriety of the players skill. They might change. Like difficulty the skill of the players is also a varying parameter. In the actual project with the historical data we observe a strong trend in skills of the players.
In the end, for this post, we shared our experiences on the effect of difficulty on the churn rates. In the following posts we will share how we asses the difficulties and skills on numerical way using historical data.